Author: CEPAR Researcher Dr Tom Wilson
Population forecasts are prepared regularly by statistical agencies and researchers and are widely used for a variety of planning and policy purposes. However, an inherent characteristic of forecasts is that they always deviate to some extent from the actual populations which are recorded years later. As a general rule, forecasts tend to become more inaccurate the further they extend into the future and the smaller the population. Previous studies have shown that forecasts for some age groups tend to be more error-prone than others.
It would be helpful for users if there was guidance available on the likely amount of error in population forecasts. The most common approach taken by demographers is to create probabilistic population forecasts, which instead of a single population number for each year consist of a distribution of possible numbers. But probabilistic forecasts are data-hungry and complex to produce, and have not been widely adopted outside the academic sector.
A simple approach to communicating population forecast uncertainty
In a new paper published in the Journal of Official Statistics, I suggest an alternative, simpler, way of communicating population forecast uncertainty. It borrows the concept of a shelf life from perishable food labelling. In the context of population forecasts, the ‘shelf life’ is defined as the period into the future a forecast it is likely to remain sufficiently accurate for use. In this case ‘sufficiently accurate’ is defined as the period into the future that at least 80% of past forecast errors have remained within 5%. There are, in fact, many shelf lives in any set of population forecasts because error varies by forecast variable. They will be different for the total population, populations for specific age groups, proportions of the population in specific age groups, and projected births, deaths and migration. The errors used to define the shelf life are obtained by creating synthetic ‘forecasts’ for many past periods using the same projection model and input data.
The shelf life of population forecasts
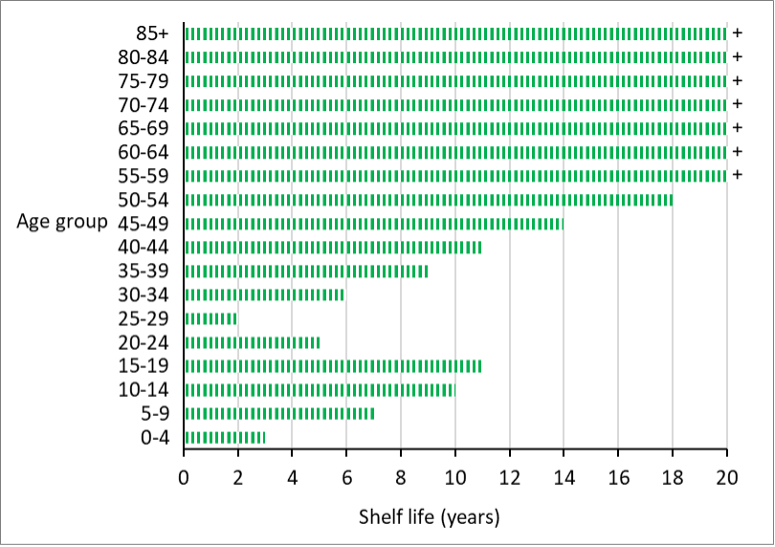
Figure 1 shows the shelf lives of forecasts of Australia’s population by age group. It demonstrates that for age groups 55-59 and above, population can be forecast quite accurately for at least 20 years ahead. For younger adult age groups, where migration flows are higher, populations lose accuracy faster. At the childhood ages, the volatility of fertility rates and migration mean than childhood populations cannot be forecast accurately for many years into the future.

Figure 1: The shelf lives of population forecasts for Australia by five year age group.
Note: Some shelf lives extend beyond 20 years but are not presented beyond this time due to too few error values from the synthetic historical forecasts. Where this is the case, they are indicated by + symbols.
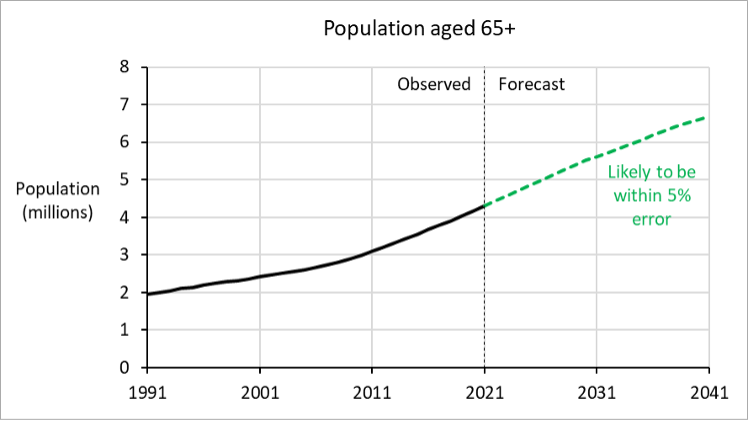
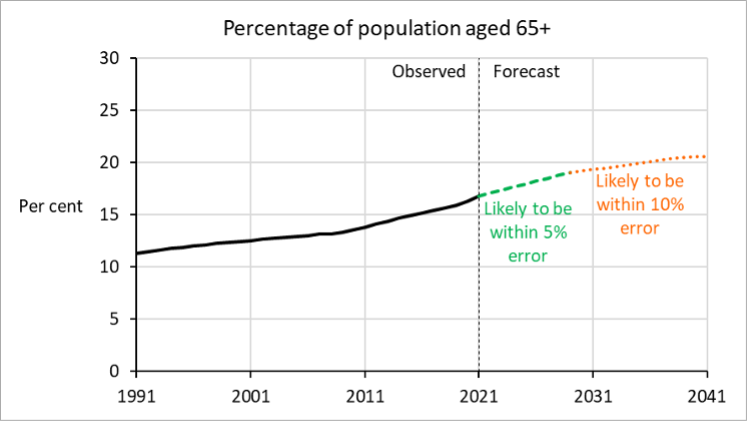
Shelf lives can be applied to current forecasts on the assumption that forecast errors of the past apply in the future (an assumption which research has shown is a reasonable approximation). Figure 2 shows a forecast of Australia’s population aged 65 and above. The number of people aged 65+ has a shelf life over at least 20 years. However, the percentage of the population aged 65+ has a shelf life of only 8 years. This is because, while the older population can be forecast accurately far into the future, the total population (the denominator of the percentage) cannot.


Figure 2: Forecasts of the population of Australia aged 65+, 2021-41
Source: Wilson, T. (2023): Visualising the Shelf Life of Population Forecasts: A Simple Approach to Communicating Forecast Uncertainty. Journal of Official Statistics.
About the author: Dr Tom Wilson is a CEPAR Researcher and an applied demographer specialising in population projections, household modelling, migration analysis, indirect estimation, advanced aged care populations, Indigenous demography, regional and local population changes, and the LGBTQ demography.
